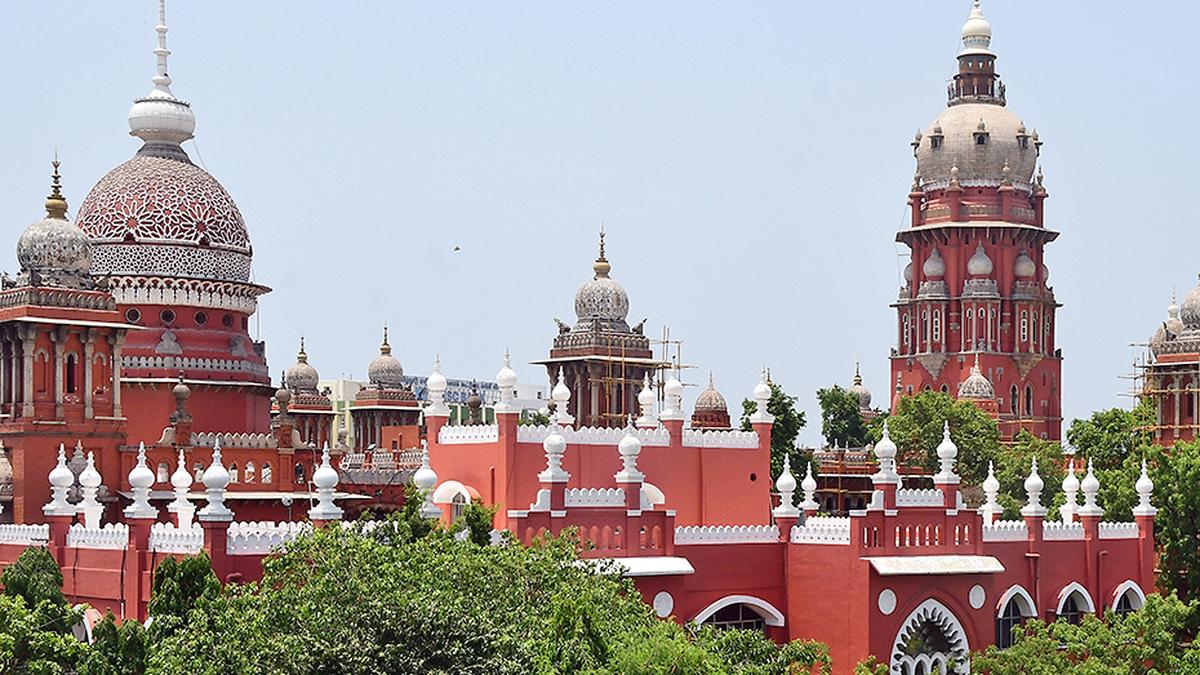
The Madras High Court received the highest number of women appointees
| Photo Credit: PICHUMANI K
Of the 17 appointees to the Madras High Court approved by the Supreme Court Collegium during the tenures of former Chief Justices of India D.Y. Chandrachud and Sanjiv Khanna, 15 (88.2%) belonged to the Backward Classes (BC), Other Backward Classes (OBC), Most Backward Classes (MBC), Scheduled Castes (SC), or Scheduled Tribes (ST). This is the highest share among 24 High Courts in that period. Data was not available for the Sikkim High Court.

In total, 221 appointments were approved by the Collegium for various High Courts in the period. The Madras High Court accounted for 33% of all approved appointees from the OBC category and 25% of all approved appointees from the SC category nationwide.
The next highest share of approved appointees from non-general categories was recorded in the High Courts of Telangana (85.7%) and Karnataka (66.7%). Along with Manipur, these were the only four States where the share of such approved appointees reached or exceeded the 50% mark (Chart 1).
Chart 1 | The chart shows the community-wise share of approved appointments in each High Court (in %)
The Andhra Pradesh High Court recorded a 27.3% share of appointees from the non-general categories, which is higher than the national average of 24.4%. Read with the data above, this shows that the representation of individuals from the non-general categories was relatively higher in the southern States. Only in Kerala, less than 20% of the approved appointees were from non-general categories.

In contrast, all the appointees approved to nine High Courts — Calcutta, Delhi, Jharkhand, Madhya Pradesh, Meghalaya, Orissa, Punjab and Haryana, Patna, and Tripura — were from the general category. In Gujarat, Uttarakhand, and Rajasthan, the share of approved appointees from the non-general categories was below 17%.
Of the 221 approved appointments, 14 individuals — all from the general category — were related to sitting or retired judges of the High Courts or the Supreme Court. None of these appointments occurred in the southern High Courts. The highest number of such appointments was recorded in Rajasthan (3), followed by Chhattisgarh, Allahabad, and Patna (2 each), as shown in Chart 2.
Chart 2 | The chart shows approved appointees to High Courts who were related to sitting or retired judges of HCs or the SC
Of the 221 approved appointees, 34 were women (Chart 3). The Madras High Court received the highest number (5), followed by Andhra Pradesh, Bombay, Delhi, Gujarat, and Telangana (3 each).
Chart 3 | The chart shows approved appointees to High Courts who were women
Notably, among the five women appointed to the Madras High Court, one was from the BC community, one from the MBC community, and three from the OBC category. Other High Courts that approved appointments of women from non-general categories included Telangana (1 BC, 2 OBC) Kerala (1 OBC), Andhra Pradesh (1 SC), Rajasthan (1 OBC), and Guwahati and Manipur (1 ST each).

Although the selection process is uniform across all the High Courts, the significant variation in representation among different social groups across States suggests the presence of subtle influencing factors.
One could be the role of Chief Ministers, whose opinions are taken into account, along with the inputs from the State Intelligence Branch, by the Collegium during the appointments process.
But it is not clear how much influence the Chief Ministers have. Another could be the better upward social mobility of BCs in the southern States. If we look at the share of BCs in higher education, for instance, while Tamil Nadu is home to about 10% of India’s OBC population, it accounts for about 13% of OBCs enrolled in higher education nationally.
In contrast, Bihar, which has over 12.2% of India’s OBC population, contributes less than 8% of OBCs in higher education nationwide.
The data for the charts were sourced from the Supreme Court of India’s website
Published – May 21, 2025 07:00 am IST
