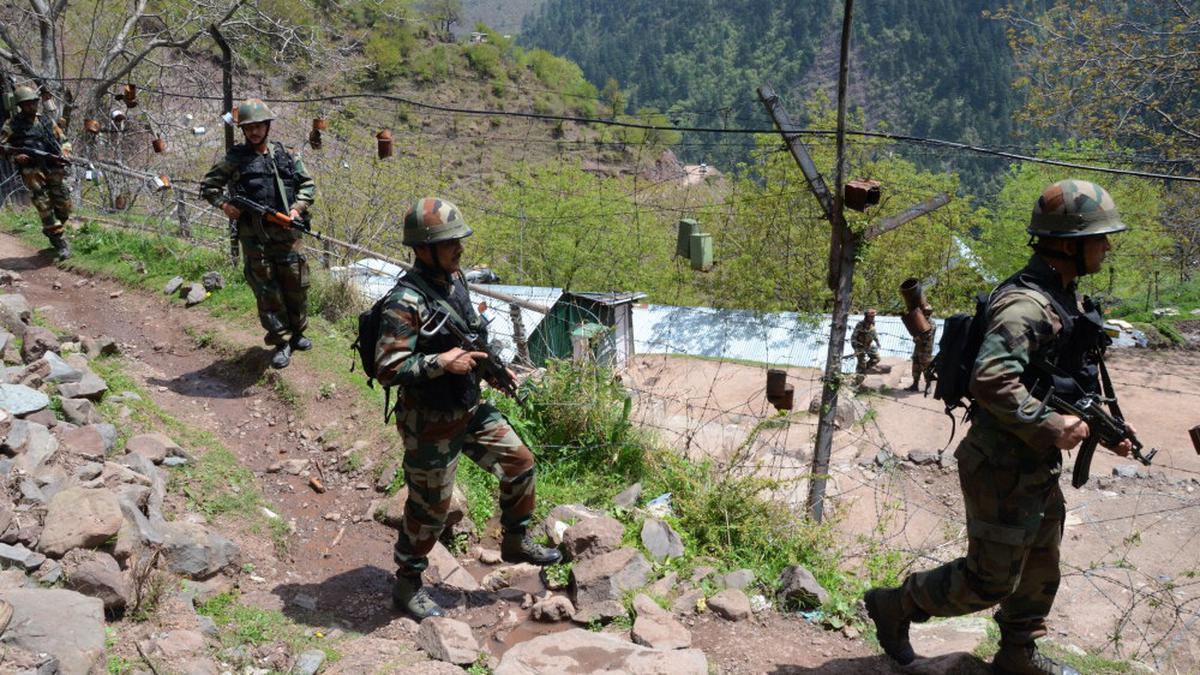
Army soldiers take position as they patrol along border fence at India-Pakistan Line of Control (LoC) on the forward post of Gowhalan, Uri.
Except in Gujarat, exports from most western border districts of India were already minimal and stagnating, and reductions in poverty levels were significantly slower. Recent India-Pakistan tensions and cross-border shelling along the Line of Control (LoC) are further threatening to disrupt economic activity in the region. Twenty-two districts in the States of Gujarat, Rajasthan, Punjab, and J&K U.T. along India’s western border are identified as border districts.
The constant threat from a hostile neighbour meant that many of the 19 districts along the western border in J&K, Punjab, and Rajasthan were doing considerably worse economically when compared to the States’ averages. Data show that the proportion of the population living below the poverty line declined much more slowly between 2015-16 and 2019-21 in many western border districts across these three States, compared to the respective State averages.

For instance, at least 50% or more border districts in J&K, Punjab, and Rajasthan had a slower decrease in the share of population living under the poverty line when compared with the respective States’ averages, as shown in Chart 1A. In contrast, in Gujarat, all the border districts had a faster decrease in the share of the population living under the poverty line when compared with the State’s average.
It is not just the western border districts which are suffering; many eastern border districts are facing more severe challenges. In Assam, 75% border districts had a slower decrease in the proportion of the population that is poor than the State’s average between 2015–16 and 2019–21. Corresponding shares in Meghayala were 86%, 60% or more in Manipur, Tripura, and Nagaland, and over 50% in Arunachal Pradesh and West Bengal (Chart 1B). Seventy-one districts along India’s eastern border are identified as border districts.
Along with a slower decline in poverty, exports from the western border districts — which were already minuscule — had also stagnated, again except in the case of Gujarat. The value of exports from western border districts, apart from Gujarat, as a share of India’s total exports, stagnated at a minuscule 0.3% between FY22 and FY25 (Chart 2A). Notably, exports from western border districts of Gujarat, as a share of India’s total exports, increased from 1.9% in FY22 to 3% in FY24.
In terms of export share as well, the eastern border districts perform significantly worse than their western counterparts. Sample this, just the three border districts of Gujarat contributed around 3% of India’s exports in FY24, while all the 71 eastern border districts put together formed just 0.3% — 10 times less.
The share of the eastern districts in India’s total exports remains stagnant under 0.5%, as shown in Chart 2B. The fact that the north-eastern States are landlocked and consignments are usually sent by air or sea from outside the region could explain the muted growth in exports in that region. However, exports this financial year could additionally be affected by the land port restrictions imposed by Bangladesh.
Government programmes that target infrastructural and economic development in the border areas have seen a significant decline post-pandemic. However, this decline is even more pronounced in the western border States. Central funds released to States under the Border Area Development Programme, initially started for border areas in the western region, have seen a marked decline since FY20 on both eastern and western borders (Chart 3).
Sources: NITI Aayog, Ministry of Commerce and Ministry of Home Affairs
Also Read: What war hysteria hides: deaths, destruction, disinformation
Published – May 23, 2025 08:00 am IST