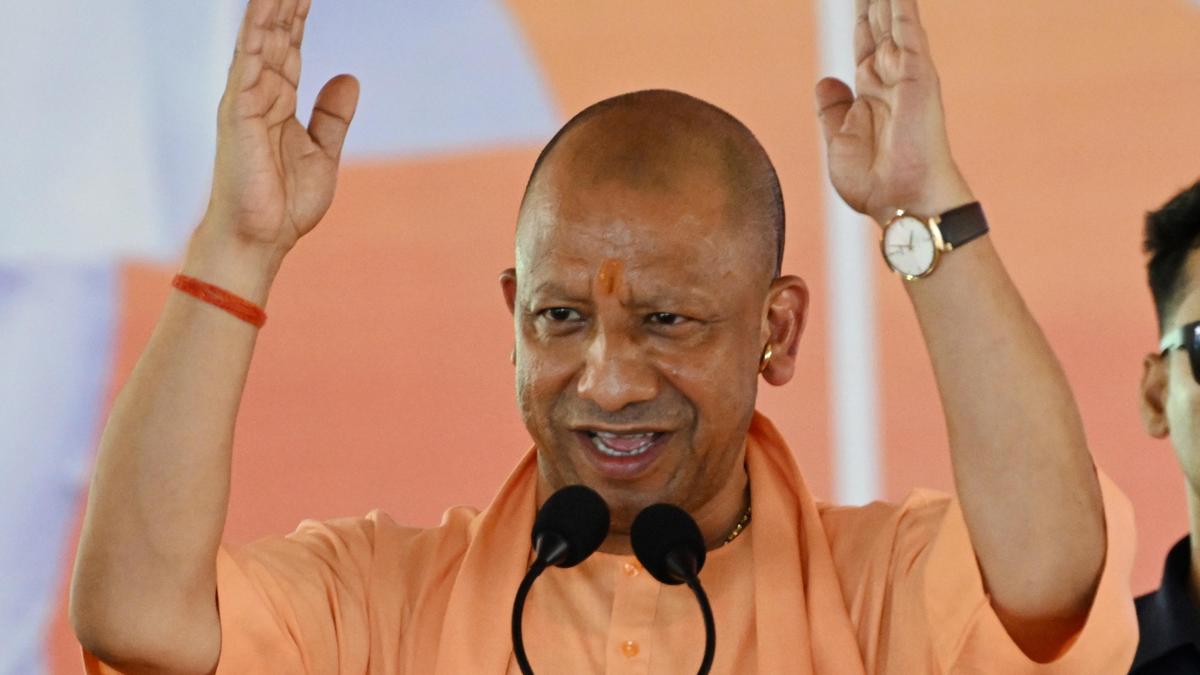
Uttar Pradesh Chief Minister Yogi Adityanath, who spoke emphatically about the State’s economic growth at his government’s Industry Leaders Roadshow in Bengaluru on June 24, highlighted how the State has become “revenue surplus in the last six years,” while shedding its image of being a “BIMARU” State — an uncomplimentary term used to refer to a group of North Indian States that lagged behind on developmental indicators.
Mr. Adityanath rarely fails to mention this “achievement” of revenue surplus in his speeches of late about the economic transformation Uttar Pradesh is witnessing after he took charge as Chief Minister in 2017.
The Comptroller and Auditor General (CAG) of India’s annual State Finances Report for the year 2024-25, released on June 16, added to the hype. As per the report, U.P. was not only among the 13 of the 28 States that reported revenue surpluses in 2024-25, but its ₹59,327 crore surplus was the highest, accounting for nearly half of these 13 States’ total revenue surplus of ₹1.27 lakh crore.
Curiously, almost none of the remaining 12 States, as shown below, are among those known for performing better on most developmental indicators.
| S. No. | State | Revenue surplus in 2024-25 (in ₹ crore) |
| 1 | Uttar Pradesh | 59,327 |
| 2. | Odisha | 22,651 |
| 3. | Gujarat | 18,943 |
| 4. | Arunachal Pradesh | 8,597 |
| 5. | Jharkhand | 7,924 |
| 6. | Goa | 2,868 |
| 7. | Tripura | 1,585 |
| 8. | Madhya Pradesh | 1,573 |
| 9. | Uttarakhand | 1,458 |
| 10. | Manipur | 1,113 |
| 11. | Nagaland | 753 |
| 12. | Sikkim | 482 |
| 13. | Meghalaya | 73 |
| Total | 1,27,347 |
An analysis of the State Finances reports of the CAG and the Reserve Bank of India (RBI) showed that the “revenue surplus” status of at least some of these States is not the result of buoyant growth in revenues or commendable fiscal discipline, but primarily of their inability to spend the budgeted amount despite the availability of funds.
U.P., the biggest State and the third biggest economy in the country, which has the biggest budget, highest revenue surplus, and highest allocation from the Centre, in fact exemplifies this problem.
1. Ideal State on paper?
The Fiscal Responsibility and Budget Management Act and the Fiscal Responsibility Legislations of States emphasise that borrowing should ideally be done for capital expenditure and not for revenue expenditure.
Hence, while a fiscal deficit within prescribed limits is not considered bad, a revenue deficit is seen as a symptom of poor fiscal discipline.
Going by these standards, U.P. stands out as the ideal case, reporting a high revenue surplus and a manageable fiscal deficit. The chart below shows the revenue and fiscal status of the top 10 economies in the country in terms of their Gross State Domestic Product (GSDP).
2. The underspending problem

Though U.P.’s revenue and fiscal indicators portray a rosy picture, its expenditure pattern shows that the revenue surplus is mainly due to the huge deviation from its total budgeted expenditure, including capital expenditure.
The chart below shows the percentage of underspending by the 10 States, compared with their budgeted expenditure.
Telangana’s underspending was bigger than U.P.’s. However, its problems—and those of Andhra Pradesh, which is now more dependent on Central transfers—are the outcome of their bifurcation in 2014. Moreover, unlike U.P., Telangana reported a revenue deficit of ₹9,420 crore.
3. The problem is persistent

An analysis of the past 10 years’ data showed that U.P.’s pattern of underspending—which is also an indicator of poor budgeting, besides its inability to spend efficiently—has been persistent. The chart below shows the deviation from the budgeted expenditure of the 10 States. Since 2019-20, U.P. has consistently underspent its budgeted expenditure by at least 15%.
4. A comparison with Maharashtra

U.P.’s budgeted receipts and expenditure are the highest in the country, with Maharashtra being the only State with comparable figures. The comparison of these two States’ budgeted versus actual receipts and expenditures shows how U.P.’s revenue surplus is a likely outcome of its underspending.
A revenue surplus or deficit is the difference between total receipts and total revenue expenditure.
The chart below shows how revenue realisation fell short by 16% for U.P. Yet, it managed to report a revenue surplus, although a slightly smaller figure than what its budget estimated, because its revenue expenditure also fell sharply by 15.4%.
In contrast, Maharashtra budgeted for a small revenue deficit and stuck closer to its plan, in terms of revenue realisation, and expenditure.
5. What if U.P.’s spending pattern were similar to others’?

The chart below shows what U.P.’s revenue surplus or deficit would have been had its revenue expenditure been as budgeted, or at the rate of deviation of its peers—Maharashtra (-1.47%), in terms of budget size, and Madhya Pradesh (-4.86%), in terms of comparable developmental indicators and dependence on Central transfers—or at the average rate of deviation of all States (-6.09%).
6. Deviation worse in capital expenditure

While one could argue that U.P.’s shortfall in revenue expenditure was perhaps due to a prudent cutting down of expenses in anticipation of a revenue shortfall, its pattern on capital expenditure shows why underspending is likely a systemic issue in the State.
The chart shows how U.P.’s deviation from its plan was far worse in capital expenditure than in revenue expenditure.
In 2024-25, U.P.’s budgeted capital outlay was ₹1.55 lakh crore, but its actual expenditure was only ₹1.13 lakh crore—a shortfall of around ₹41,800 crore (-27%). In fact, the deviation in capital expenditure was -23.6%, even when compared with the capital outlay’s revised estimate, which the State would have arrived at in the middle of the financial year, when it had a better forecast.
7. Lowest developmental expenditure

Revenue expenditure is generally understood to involve the operational costs of running the government, although it includes significant expenditure towards improving developmental indicators as well.
RBI’s reports capture this component of revenue expenditure as “developmental expenditure” under two broad categories of social and economic services of the government. Analysis showed that U.P.’s per capita developmental expenditure in revenue account was the lowest among the top 10 economies.
8. Heavy reliance on Central transfers

The fact that U.P. is able to report revenue surpluses every year is made possible in no small measure by Central transfers, which have consistently accounted for more than 50% of the State’s total revenue—the highest for a major State besides Bihar.
The chart below shows how the share of Central transfers in total revenue has declined for some States among the 10 biggest economies, while it has remained fairly the same for U.P.
9. GoI’s share left unspent

Importantly, U.P.’s expenditure pattern showed that despite receiving the lion’s share of funds from the Central government, it was not able to spend the money as budgeted.
The chart below shows the Government of India’s share in the budgeted outlay towards Centrally Sponsored Schemes for four States, and the deviation in the actual utilisation of these funds. U.P.’s deviation was -38.4%, which means it fell short of spending even two-thirds of GoI’s budgeted share.
10. U.P.’s peculiar fiscal situation
The first chart showed how U.P. appeared to be the standout case of prudent fiscal management, with its revenue surplus and fiscal deficit.
The chart below shows how the patterns discussed above indeed put U.P. in a peculiar position among the 10 biggest economies—perhaps not in an ideal way, but in a concerning manner—since the money it left unspent (compared with its budget in both revenue and capital accounts) was nearly twice the size of its fiscal deficit.
In other words, it planned its borrowing for the year as per its budget, but ended up underspending far more than it actually borrowed.

To offer an analogy, let us assume a family’s annual revenue is ₹10 lakh, of which its planned recurring expenditure is ₹9.5 lakh. There is a buffer of ₹50,000 (similar to revenue surplus). It plans to take up some long-pending repair works in its house at a cost of ₹2.5 lakh.
The total estimated expenditure for the year is therefore ₹12 lakh and the family plans to borrow ₹2 lakh (similar to fiscal deficit) to meet the gap between its revenue and expenditure.
Now, if the revenue unexpectedly drops to ₹9 lakh, the family cuts down the educational expenditure of its children to bring down its recurring expenditure to ₹8.5 lakh, and ends up leaving the repair works incomplete by spending only ₹1.5 lakh, it would have then spent a total of ₹10 lakh and therefore had to borrow only ₹1 lakh.
The family borrowed less, but it underspent its budget by ₹2 lakh, with an impact on the children’s education and the repair works. The question is whether this is a desirable outcome for a family aspiring for upward social mobility.. U.P. can do itself a favour by introspecting on a question that may not be all that different.
(The analysis used data only till 2024-25 as it is the latest year for which the actuals are available.)