Nearly seven in 10 people in developing countries are expected to be living in cities by 2050 given rapid urbanisation. While urban growth provides greater access to jobs and essential services, it also brings challenges with it such as traffic congestion and air pollution, which significantly impact health.
In India, a Lancet study reports that from 2008 to 2019, short-term exposure to PM2.5 particles accounted for nearly 30,000 deaths annually across 10 major cities, representing 7.2% of all deaths. This includes around 5,100 deaths per year in Mumbai, 4,678 in Kolkata, and 2,870 in Chennai. The chart shows the number of deaths attributable to PM2.5 exposure every year in the 2008-2019 period
These alarming figures have prompted many cities, including Cairo (Egypt), Dakar (Senegal), Santiago (Chile), and Bogotá (Colombia), to explore cleaner public transport options. As a result, demand for electric vehicles (EVs) has risen globally.
By 2023, there were 40 million electric cars on the world’s roads — a 35% increase from the previous year. However, EVs still represent only a small share of total global vehicles. The chart shows electric car sales from 2012 to 2024.
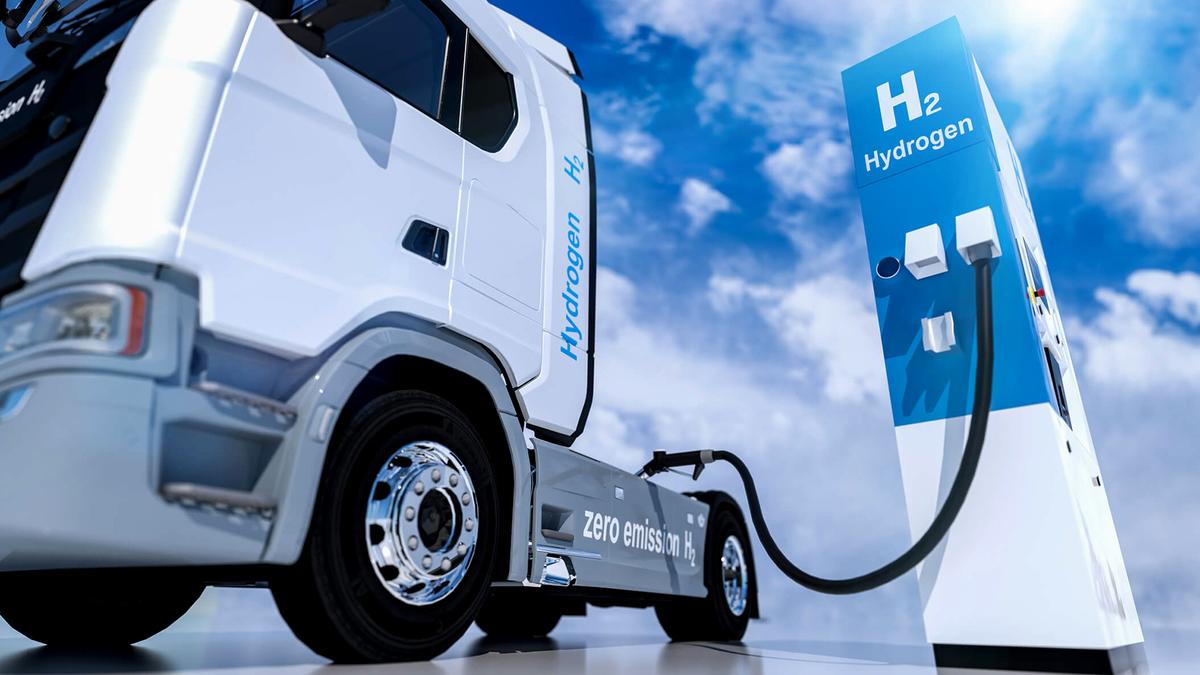
Over half of global sales took place in China, followed by Europe and the U.S., with other regions contributing a much smaller share. While battery electric vehicles (BEVs) dominate the market, Fuel Cell Electric Vehicles (FCEVs) present an alternative with several advantages — they have a longer driving range due to higher energy density, can refuel in just 5-15 minutes, and are generally lighter than battery-powered vehicles. They are particularly suitable for long-distance travel, rugged terrain, and extreme cold.
However, FCEVs remain rare, with only 93,000 units globally — equating to just one hydrogen vehicle for every 330 battery-powered ones. This is largely due to their high initial and operational costs. The chart shows the initial cost of various vehicles.
As shown in the chart, fuel cell buses and trucks cost 20–30% more than their battery-electric counterparts. Nonetheless, prices for both are expected to converge by 2030 as technology improves.
Operational costs, however, remain a concern. The chart highlights the cost per kilometre for various vehicle types.
Diesel buses cost about $0.27 per km, while electric buses cost only $0.17, making them more economical despite their higher upfront cost.
In contrast, hydrogen fuel cell buses are significantly more expensive to operate. Blue hydrogen, produced from natural gas, costs $0.84 per km, while green hydrogen, derived from renewable sources, costs $0.91 per km. Experts predict that the initial cost of hydrogen vehicles will match that of battery-electric vehicles within the next five years. However, their operational costs are expected to remain high, even beyond 2030.
In India, the adoption of EVs is progressing at a steady pace. EVs accounted for approximately 5% of total vehicle sales in 2023. Electric car registrations rose by 70% year-on-year to 80,000 units compared to just a 10% growth in overall car sales. However, the most rapid growth was in the three-wheeler segment, where India accounted for nearly 60% of global electric three-wheeler sales. In fact, in 2023, India surpassed China to become the largest market for electric three-wheelers, with over 0.58 million units sold.
India also ranks as the world’s second-largest market for electric two-wheelers, with 0.88 million units sold in 2023. But this figure is significantly lower than China’s 6 million units. Notably, China, India, and ASEAN countries dominate the global market for electric two- and three-wheelers, while all other regions combined contribute less than 5% to global sales in these categories.
The data for the charts and story were sourced from World Bank Blogs, LANCET and lEA’s Global EV Outlook 2024
Published – July 30, 2025 07:00 am IST