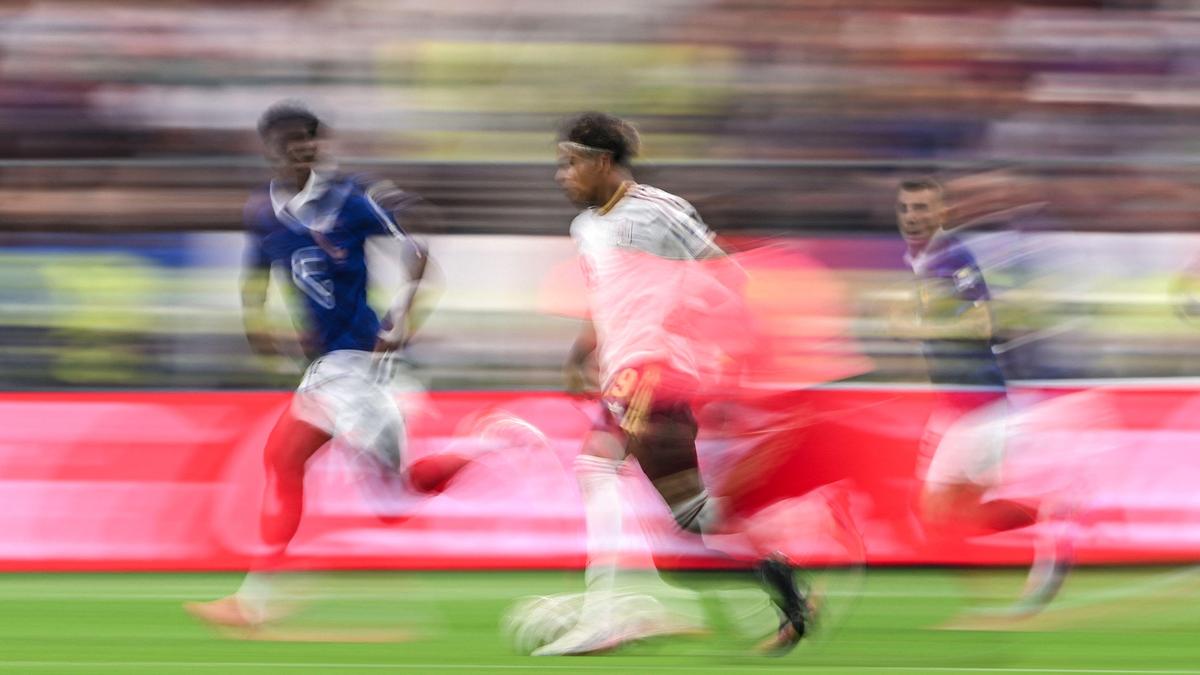
Lamine Yamal of Spain runs with the ball during the FIFA World Cup 2026 semi-final match between France and Spain at Dallas Stadium on July 14, 2026, in Arlington, Texas.
| Photo Credit: DAVID RAMOS
The stage is all set for the final battle of the longest-ever FIFA World Cup, spanning 39 days, at the New York New Jersey Stadium at 12.30 a.m. on Monday, July 20, 2026 (IST).
Spain will eye their second World Cup title, after 2010. Argentina, the reigning champions led by the legendary Lionel Messi, will try to achieve something no team has managed since 1962, when Brazil, with another legend, Pelé, in their squad, became the last side to retain the cup.
The four teams that FIFA ranked highest at the start of this tournament — Spain, France, Argentina and England — all went on to reach the semi-finals.
But the ranks alone do not reveal how close or varied their performances were. The Hindu’s Srinivasan Ramani and Devyanshi Bihani decided to find that out and, while doing so, familiarise a wider audience with Elo ratings and other metrics like expected goals (xG), which the football nerds may already know. The story can be read here.
These metrics certainly bore out their FIFA rankings, but they also revealed interesting insights into where these teams differed.
xG, for instance, assigns every scoring chance a value between 0 and 1 — representing the probability that a shot from that position and situation would, on average, be converted to a goal — weighing other factors such as where the shot was taken, the type of pass or move that created it and the defensive pressure exerted by the defender on the shot-taker.
Over a match, a team’s xG is the sum of the values of the chances they created. The net difference between the average xG for a team and the average xG they conceded to their opponents is a good way to gauge how well they created chances and denied the same for their opponents.
France were in fact ahead by a hair’s breadth at the end of the quarter-finals with a net xG difference of +1.70, which is 0.01 points more than Spain’s +1.69.
France’s actual goals and the difference between the average number of goals scored and conceded were higher than their respective xG values.
However, it was perhaps Spain’s consistency and discipline — as reflected in their near-identical actual and xG values — that saw them send the formidable Les Bleus home in the first semi-final.
England were the underdogs among the four, with the lowest net xG difference, at +0.84, compared with Argentina’s +1.57. This is despite stellar performances by Jude Bellingham in particular, who had overperformed by scoring six goals with an xG of only 2.6.
It was therefore not a surprise that the Argentine squad further prolonged England’s wait for the cup to “come home” with their 2-1 win in the second semi-final match.
Argentina have scored 19 goals from chances worth 14.4 xG. Spain, by contrast, have scored 13 from 13.3 xG, which reveals the aggressiveness of the former and the stoic consistency of the latter.
The Elo system rates teams by looking at their relative performance against other teams. Elo ratings give Spain a narrow edge, placing them first in the world with 2,232 points, 32 ahead of their second-ranked opponents, Argentina. This translates into a 55 per cent winning expectancy for Spain versus 45 per cent for Argentina in the final.
These numbers are, however, more useful for post-match analyses than for predicting outcomes since the magic that finally unfolds on the field can often defy all metrics. It is such magic that fans around the globe will be hoping for when La Furia Roja meet La Albiceleste in the final.
Published – July 16, 2026 10:25 pm IST