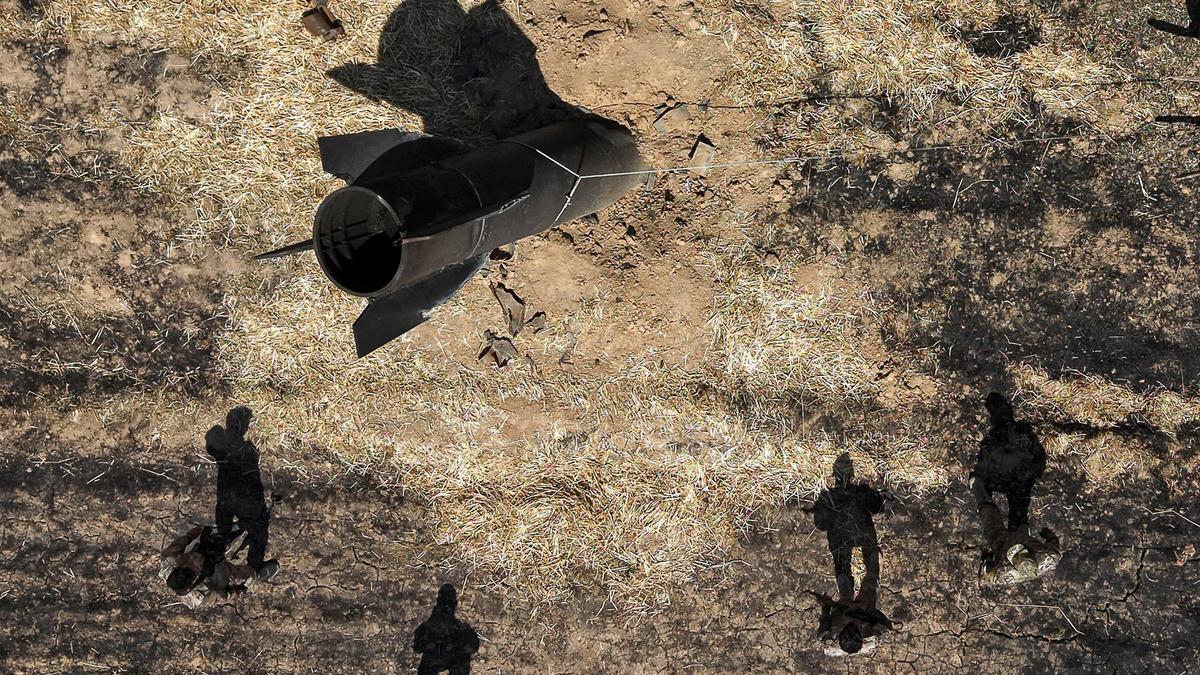
A drone view shows members of military engineering teams working at the site where, according to local authorities, an Iranian missile fell in the countryside near Damascus, Syria, on June 9, 2026.
| Photo Credit: Reuters
The U.S. and Israel sent a barrage of missiles towards Iran on February 28, 2026 after disagreements over Iran’s nuclear future and U.S.’s security concerns. On Saturday (June 13, 2026), the U.S. said it downed multiple Iranian drones targeting commercial vessels, and Israel resumed it’s strikes on southern parts of Lebanon.
Pakistan’s Prime Minister Shehbaz Sharif said, on June 12, 2026, that the U.S. and Iran have reached a “final, agreed upon text”. He said Pakistan, which has taken the lead in mediation efforts, was working with the warring countries on next steps.
Here are maps, timelines and other graphics tracking the evolution of the conflict.

Strikes
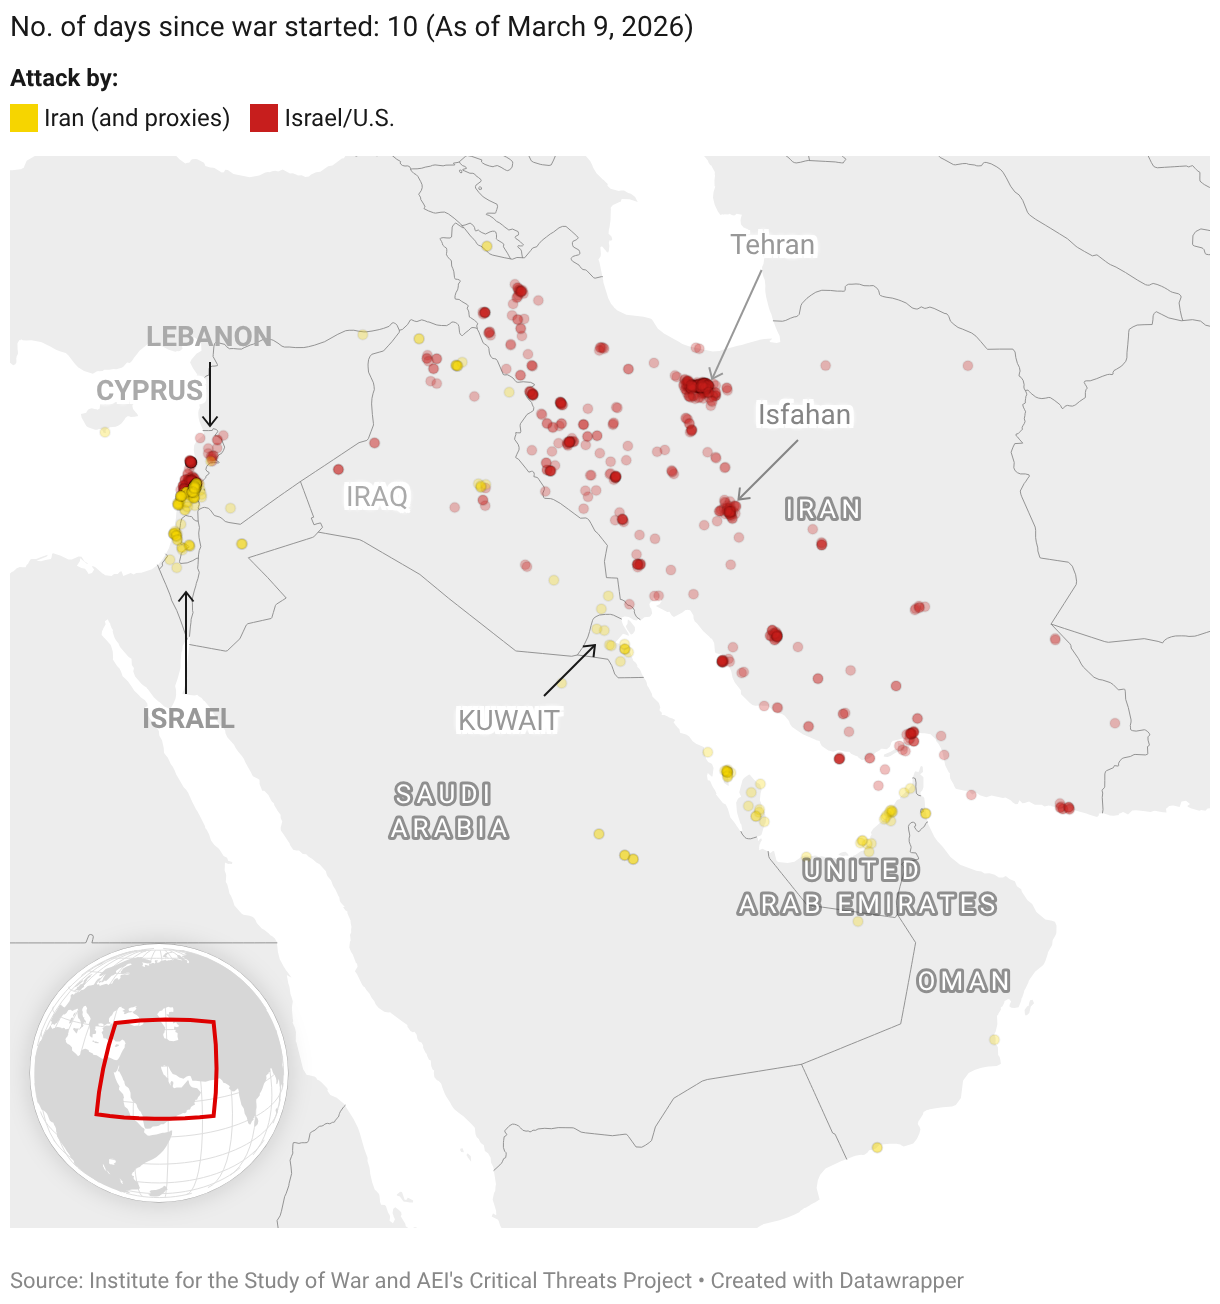
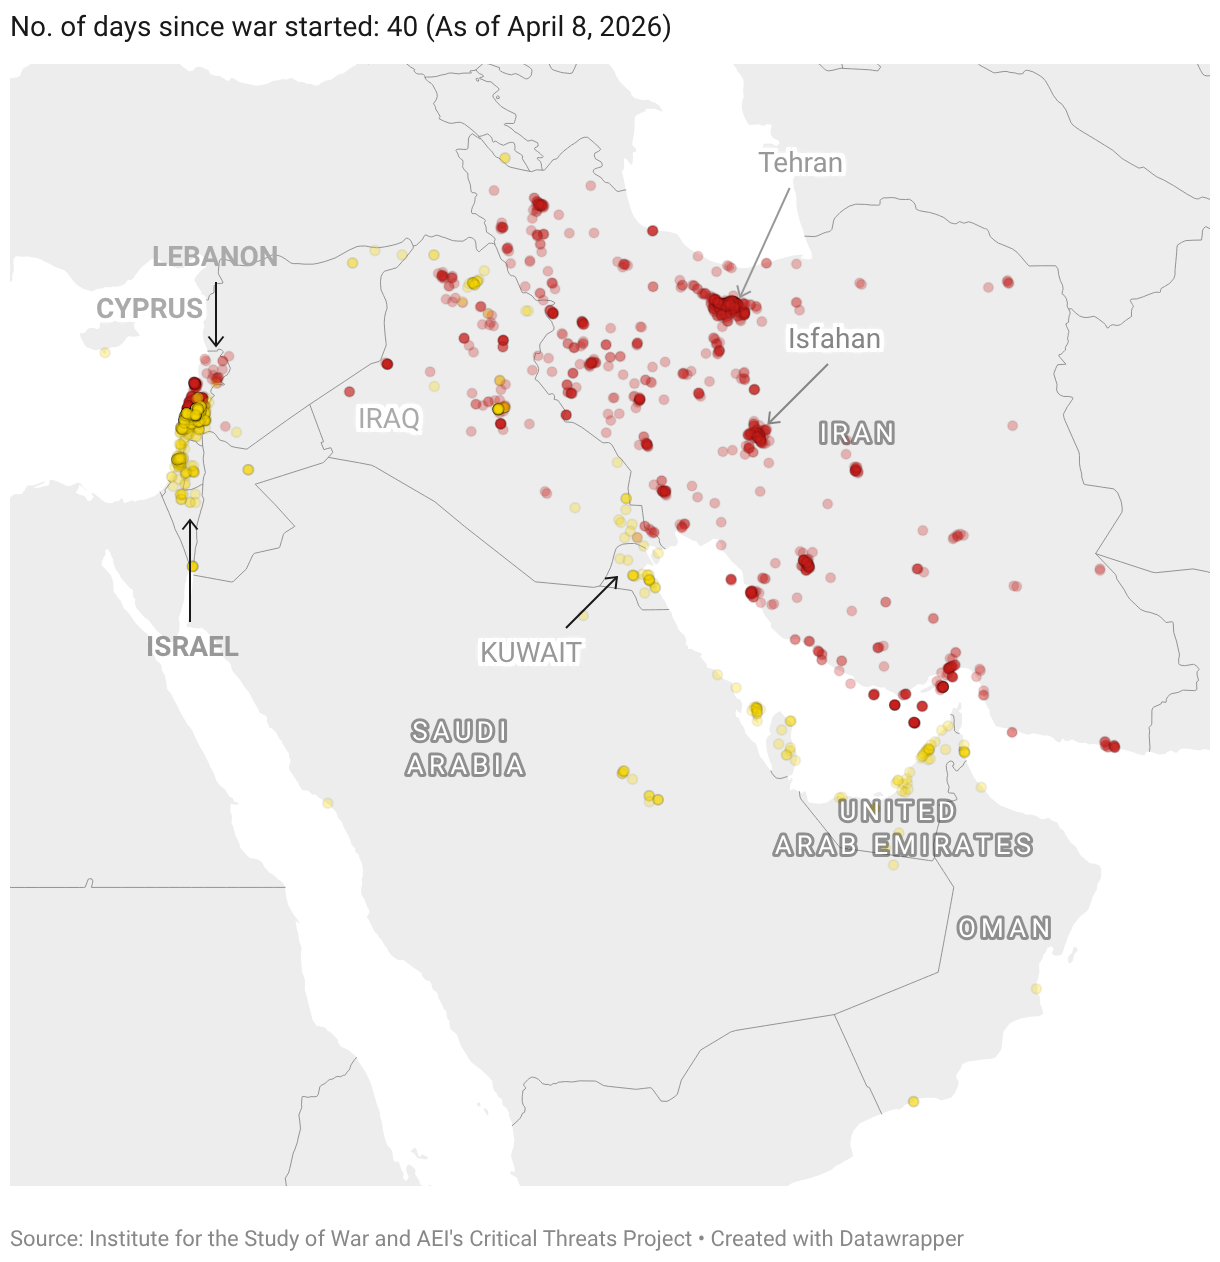
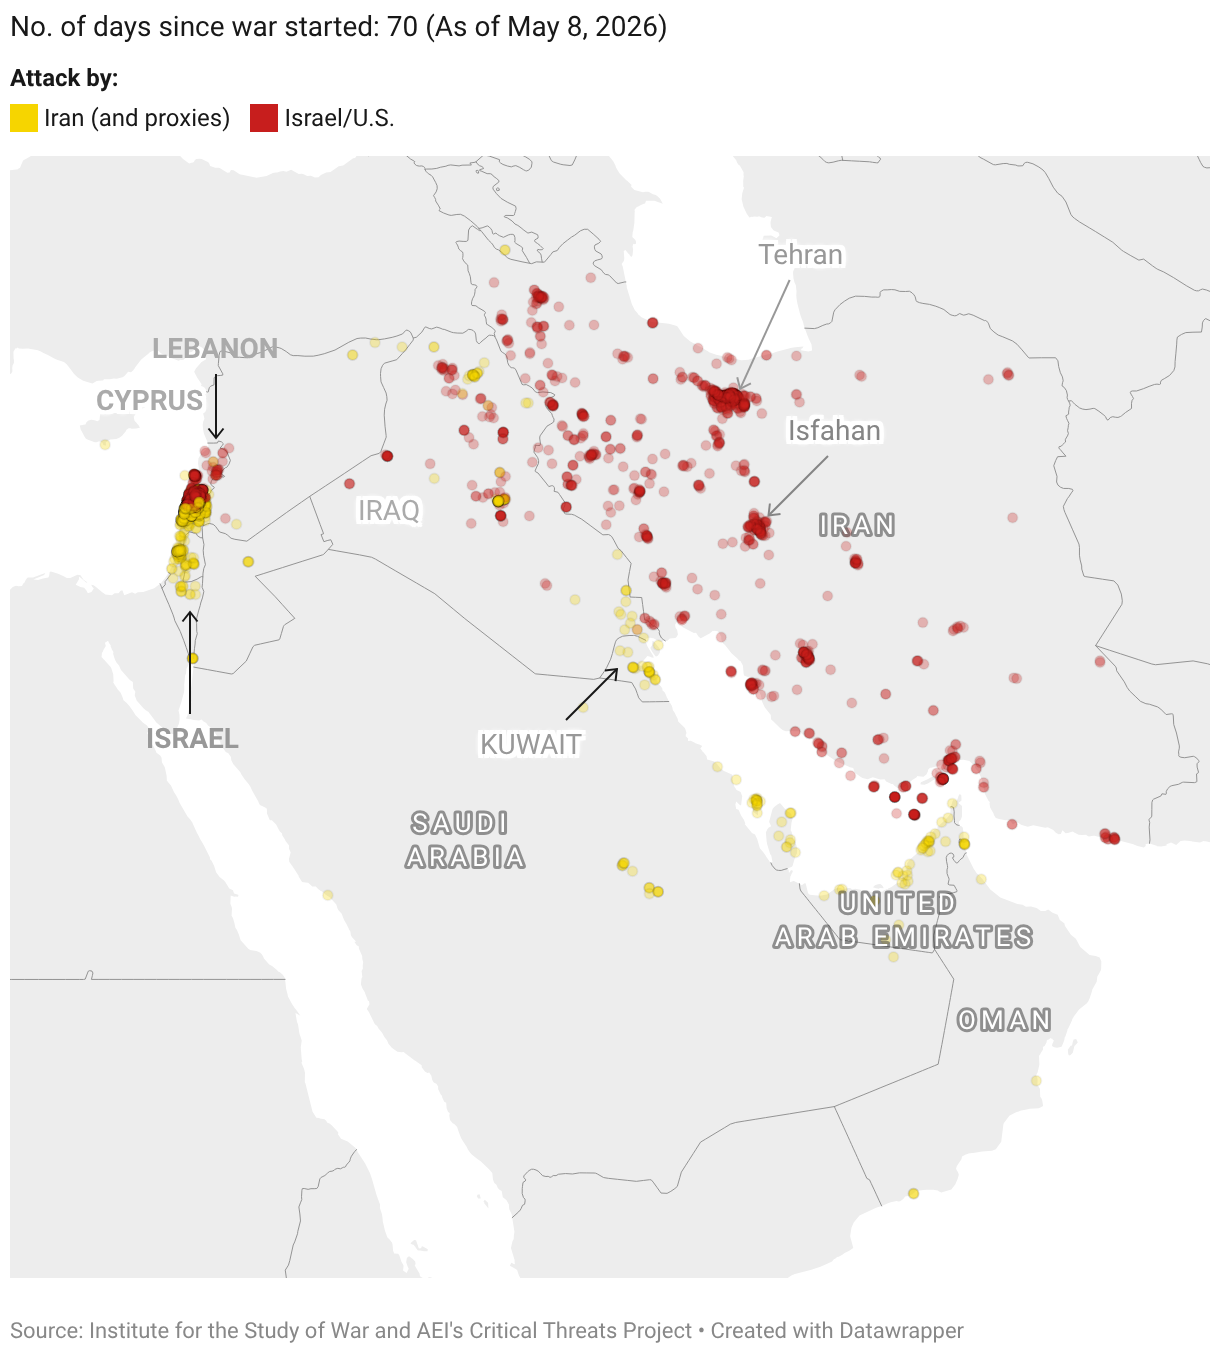
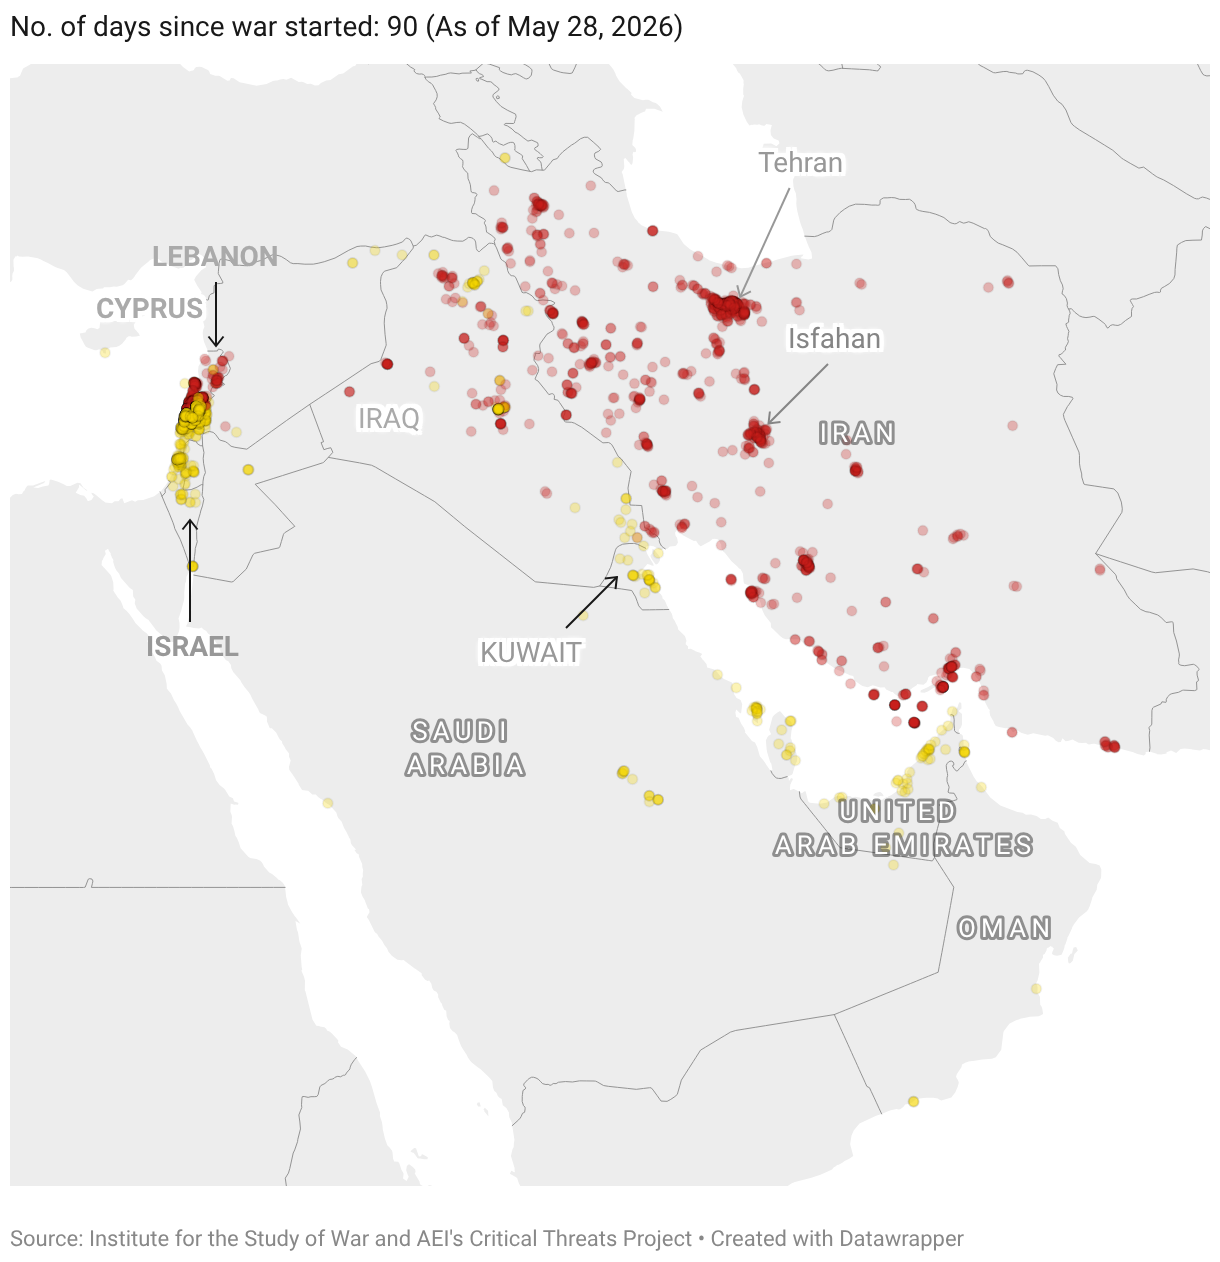
Active hostilities broke out on February 28, 2026, as the U.S. and Israel claimed to have targeted government and military sites in Iran, killing several top-level Iranian officials, including its Supreme Leader Khamenei. Over the next 100 days, with Iran’s retaliations and the increasing hostilities between Hezbollah and Israel – especially in southern Lebanon – the war has engulfed West Asia with strikes in Iraq, Qatar, UAE, Saudi Arabia, Kuwait, Oman, and Syria.
The start of the war was also marked by a horrific event where the United States bombed a primary school in Minab in Iran’s Hormozgan Province, and the surrounding compound which had medical facilities. At least 156 individuals were killed, of which 120 were school children.
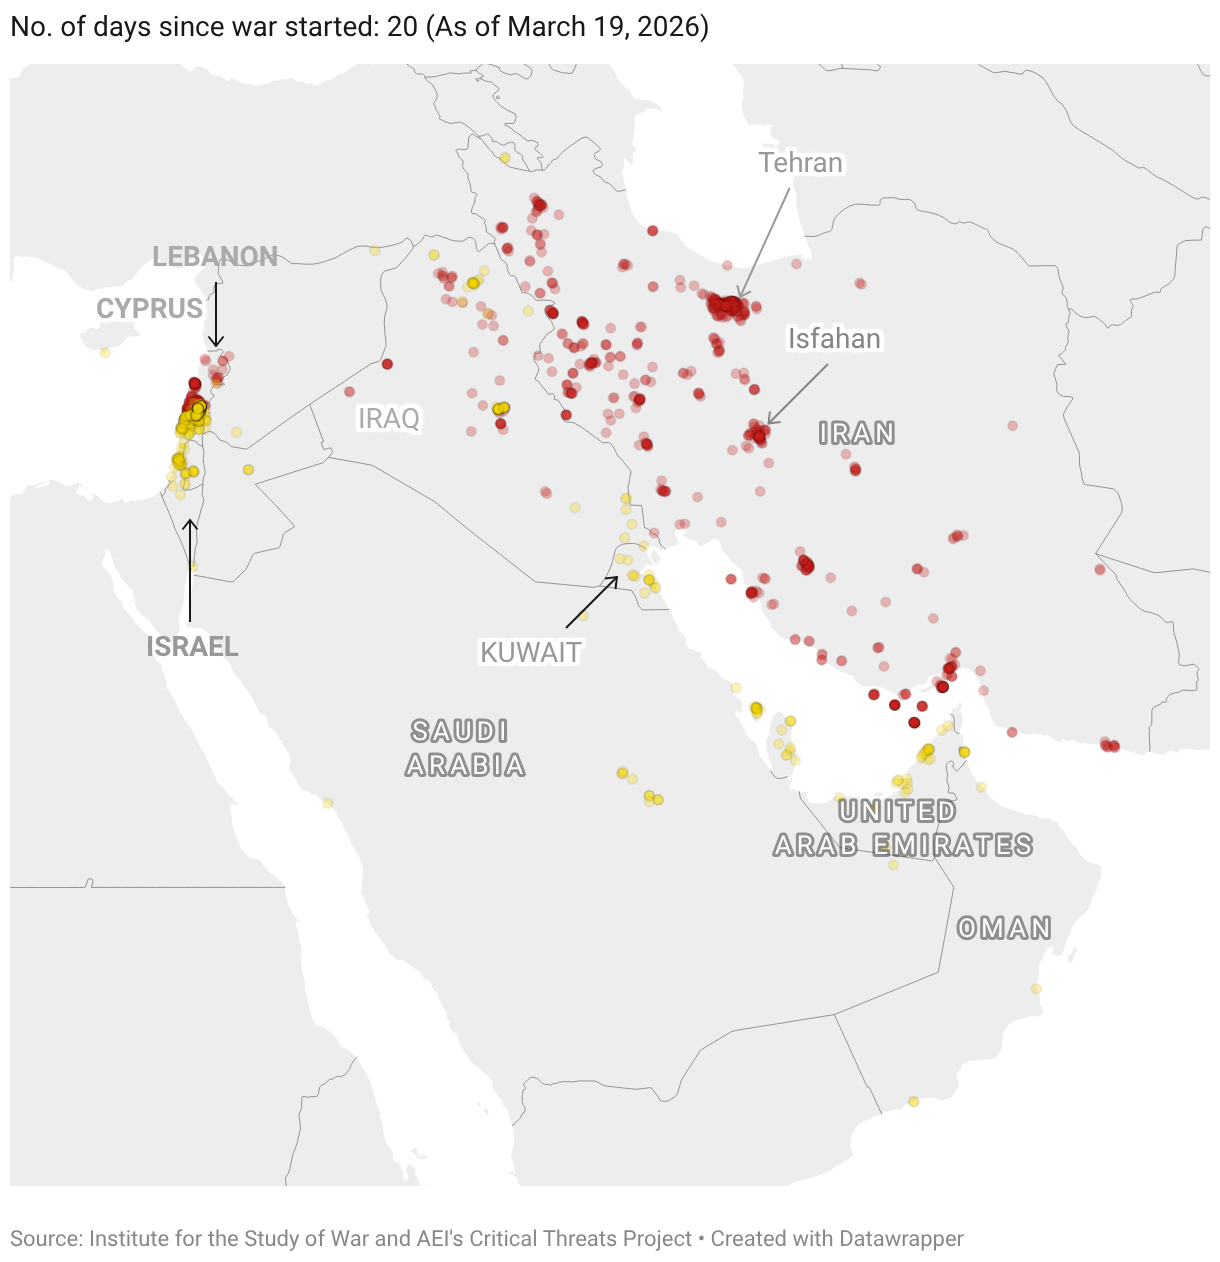
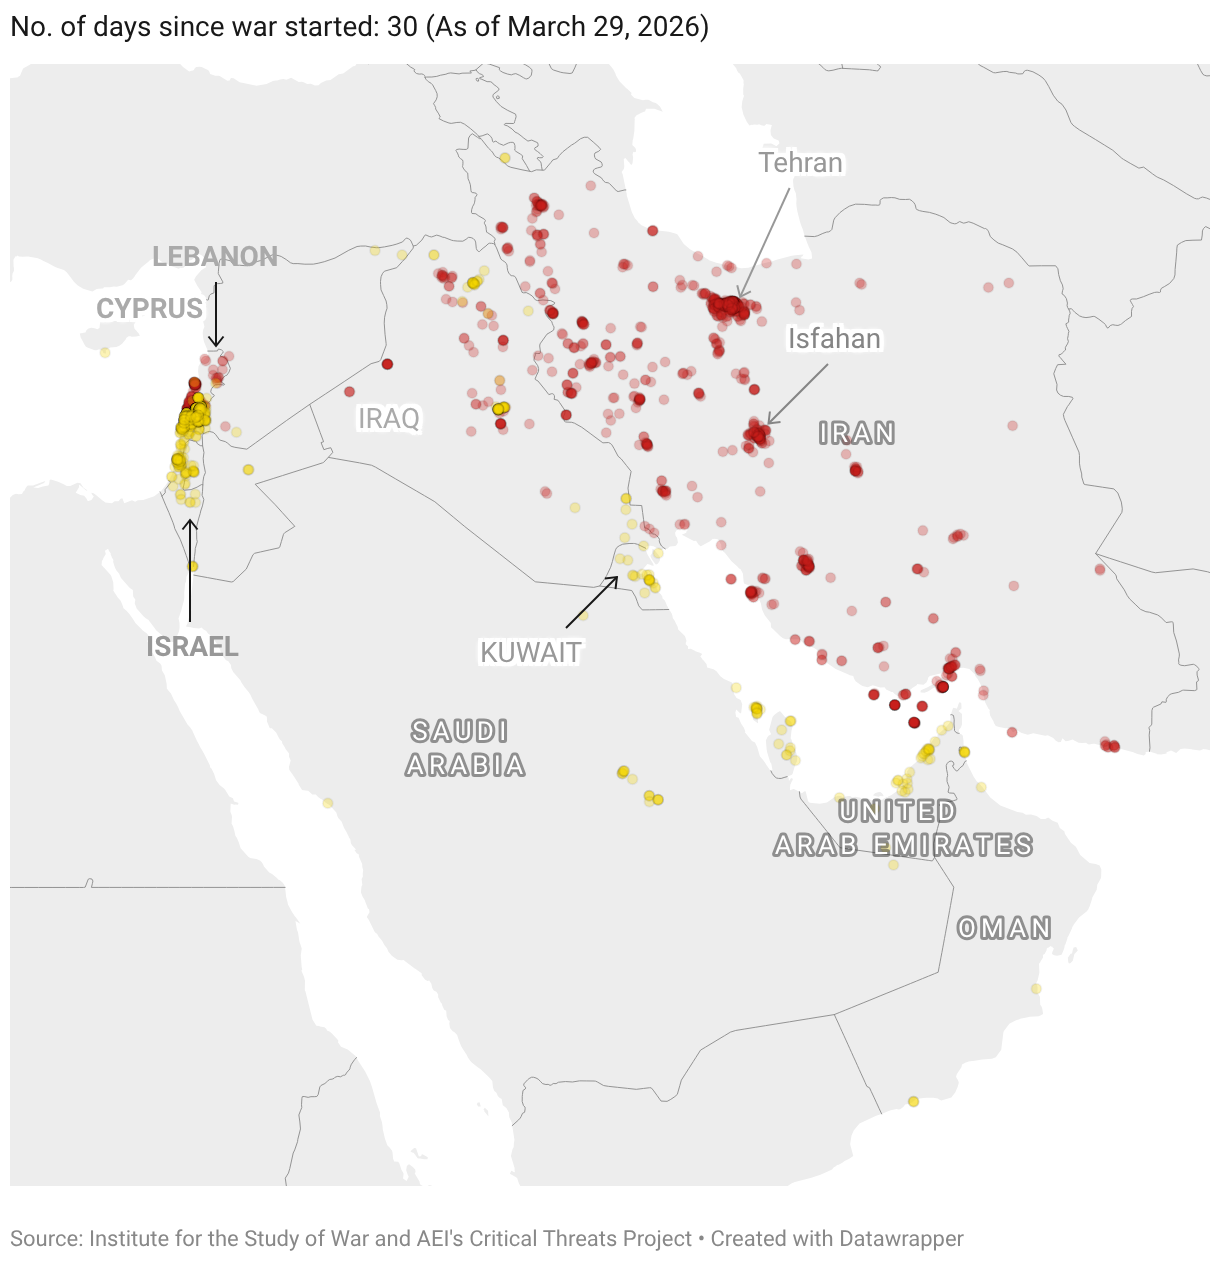
The maps below show how the intensity of the war increased over 100 days.


Fatalities
The following graphic shows the list of high ranking Iranian figures, and those that have been targeted and killed by the U.S. and Israeli strikes.

Oil prices
The Strait of Hormuz, a key trade route where almost a fifth of the and a major component of U.S.-Iran talks for lasting ceasefire, has been severely affected with the 7-day moving average of the arrival of ships in the strait dropping to below 10 on most days since February 28, as per the data on the International Monetary Fund’s PortWatch. This is in contrast to the arrivals in the strait last year, as shown in the chart below.
International oil prices have been whipped up into steep climbs ever since the start of the war, with key oil producing countries caught in crossfire between the U.S. and Iran.
The Indian government has pushed for citizens to take up austerity measures like cutting back on fuel consumption and buying Indian products to help support the falling ruppee, as well as promoting Piped Natural Gas (PNG) over the widely used Liquefied Petroleum Gas (LPG) for household consumption. This followed a crunch in commercial LPG cylinder supplies, forcing several retail hotels to shut shop in metro cities.
The conflict has also led to an increase in fuel prices in India, with the prices of petrol and diesel hiked by almost ₹7.5 in all metros.
Prices of the 14.2-kg domestic LPG cylinders were increased by ₹29 per cylinder on June 7, 2026. This is the second time that the prices were hiked since the war began. The government has justified this move by noting the fact that Indian households still continue to pay the lowest price for cooking gas globally despite a sharp rise in international LPG prices.
Published – June 15, 2026 11:02 am IST